Churn you can’t see coming
Up to 40% of churn is driven by poor coverage and quality. Operators usually discover it only after the subscriber has left.
AI-powered network intelligence for mobile operators and MVNOs. Cut churn, cut infrastructure cost by up to 50%, and see exactly where to invest to grow revenue. Built from real-world measurements. No integration, no hardware, no core access.
Multi-year contracts with tier-1 operators · Fast-growing global adoption
Lower infrastructure cost
Customer churn reduction
Annual savings per 10M subscribers
Data samples across 90+ countries
Integration, hardware or core access
Legacy tools model and guess. The costs of guessing wrong show up in churn, CAPEX and customer experience.
Up to 40% of churn is driven by poor coverage and quality. Operators usually discover it only after the subscriber has left.
Infrastructure costs run 30–50% higher than necessary: sites built where they aren’t needed while real gaps stay open.
Drive tests and simulations are slow, expensive and stale on arrival. The industry spends $5B+ a year on legacy planning tools.
A 10M-subscriber operator loses roughly $300M a year to churn. A 3% churn reduction alone returns $10M+ every year, before counting up to 50% in infrastructure savings.
Illustrative model using your inputs and the 2–6% churn-reduction range reported across Flycomm deployments. Infrastructure savings of up to 50% are not included.
New revenue, lower cost and better retention, from one independent view of your network and every competitor’s.
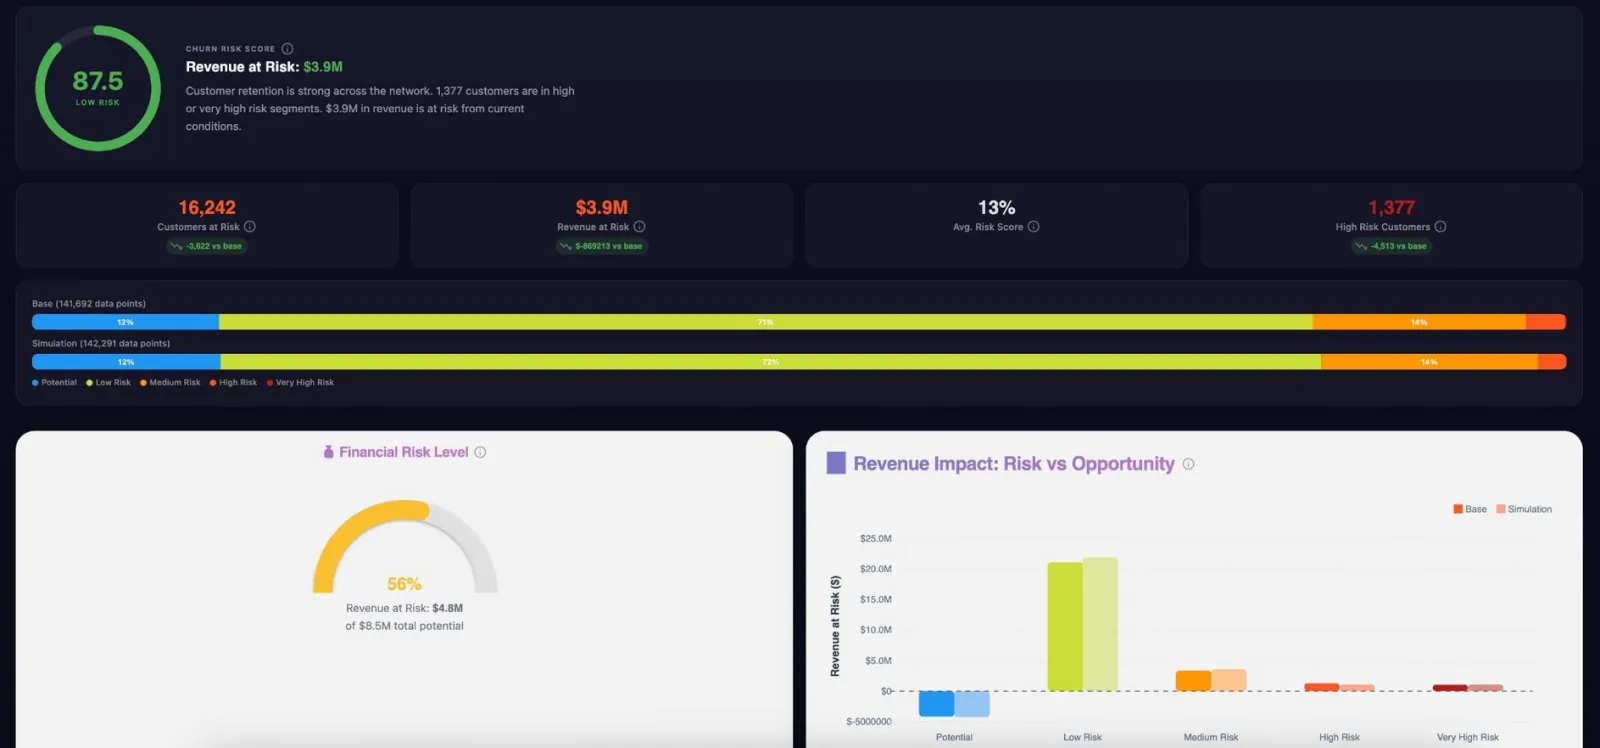
See which zones are driving customer loss and what each one is worth in revenue, so you fix the right places first. 2–6% churn reduction.
Test every site decision before you commit. Build what customers need, skip what they don’t. Up to 50% lower infrastructure cost.
Your network and every competitor’s on identical data, so marketing, sales and expansion go where you are provably better.
Coverage, cost and customer KPIs with the financial impact of every network decision. Decisions your CFO can sign off on.
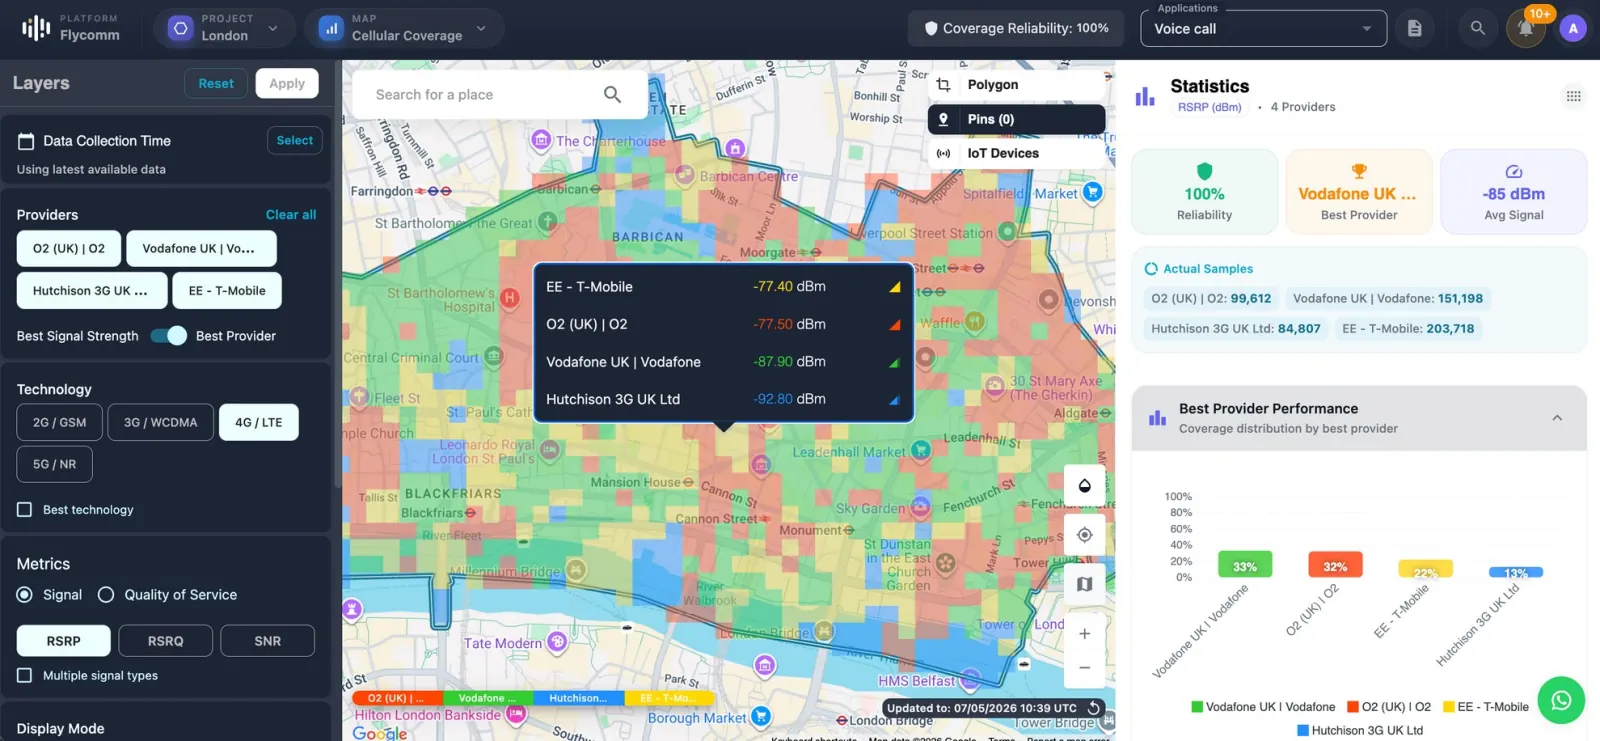
One live picture of your network and every competitor’s.
Illustrative views here; the detail is for your demo.
Every operator in your market, ranked street by street on identical measured data. See where you are the best network, and where a competitor is taking your customers.
Nothing to install in your network, no core access and no OSS/BSS integration. Flycomm arrives with its own measured data and is typically live within days.
An annual SaaS licence scaled by coverage cluster: city, regional or national, with all technologies and layers included. Paid pilot programmes are fully credited toward a full licence. Training, integration and dedicated engineering services can be bundled into a first-year order.
Scope a paid pilotTypically within days. There is nothing to install in your network, no core access and no OSS/BSS integration project.
No. Flycomm works from its own independent, real-world measurement data. Your own datasets can be added later when a use case calls for it.
Yes. Every operator and MVNO in your market is shown on identical measured data, so the comparison is fair and actionable.
No IMEI or IMSI is persisted. Device identifiers are anonymised, data is encrypted in transit (TLS 1.3) and at rest (AES-256), and retention follows your data-governance policy.
An annual SaaS licence scaled by coverage cluster: city, regional or national, with all technologies and layers included. Paid pilots are fully credited toward a full licence.
Bring one priority region. We’ll show you the measured picture of your network and your competitors’, and what the data says it is worth.
Book a telecom demoTell us what matters to your team. We’ll show you how Flycomm can turn wireless intelligence into your next advantage.
sales@flycomm.co