Technically accurate, commercially silent.
Drive tests, RF models and signal data describe the network. They never say what a site is worth to a tenant’s P&L.
AI-powered network intelligence for tower companies and neutral hosts. See every site in the market, yours and your competitors’. Rank your portfolio by what each tower is worth to a named operator, and arrive with the tenant case already built. No tenant data, no integration, no hardware.
Trusted by leading Tower Companies across Europe, Africa and Asia.
Lower infrastructure cost
The precision of legacy planning tools
To a live market, not months
Data samples across 90+ countries
Tenant data, integration or hardware
Engineering sees signal data. Commercial sees churn and ARPU. Your tenants see their own network, not your infrastructure’s contribution to it. Without one shared, measured view, every lease conversation starts from opinion.
Drive tests, RF models and signal data describe the network. They never say what a site is worth to a tenant’s P&L.
Churn and ARPU trends are real, but not tied to a specific site, a specific lease or a specific operator.
Operators see their own performance, with no visibility into your infrastructure’s role in it. Nobody on their side is building your case.
Four questions decide whether a colocation or new-tenant proposal gets signed: where service is degraded, which operator it affects, what that exposure is worth, and which of your sites resolves it. Flycomm answers all four from the same measured layer, before you approach the operator.
Illustrative model using your inputs only. It shows what each step in tenancy ratio is worth across the portfolio; Flycomm builds the site-by-site tenant case that earns the step.
Stronger site decisions, sharper tenant proposals and more valuable infrastructure, from one independent view of every operator around your sites.
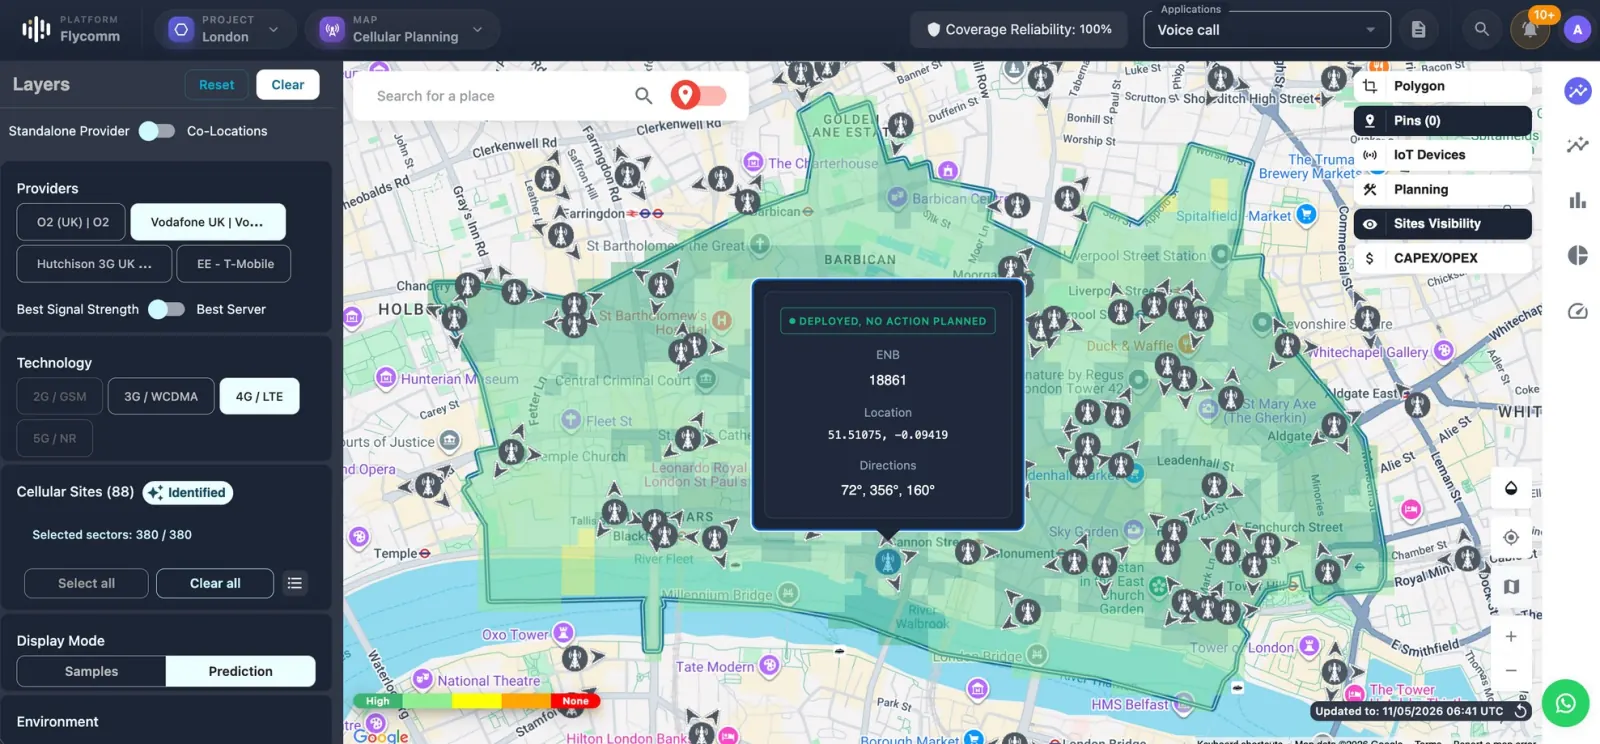
A complete tower and sector inventory for every operator in the market, built from measurement alone. No operator data, no tenant cooperation.
Each site scored by the customers and revenue it would protect for a named operator, so every proposal leads with the operator and the number.
Add a tenant to an existing structure in simulation and compare before and after. Prove the site works before the commercial conversation starts.
Cost per km², best-server area and redundancy for every site in the portfolio. Renegotiate, consolidate or invest on evidence.
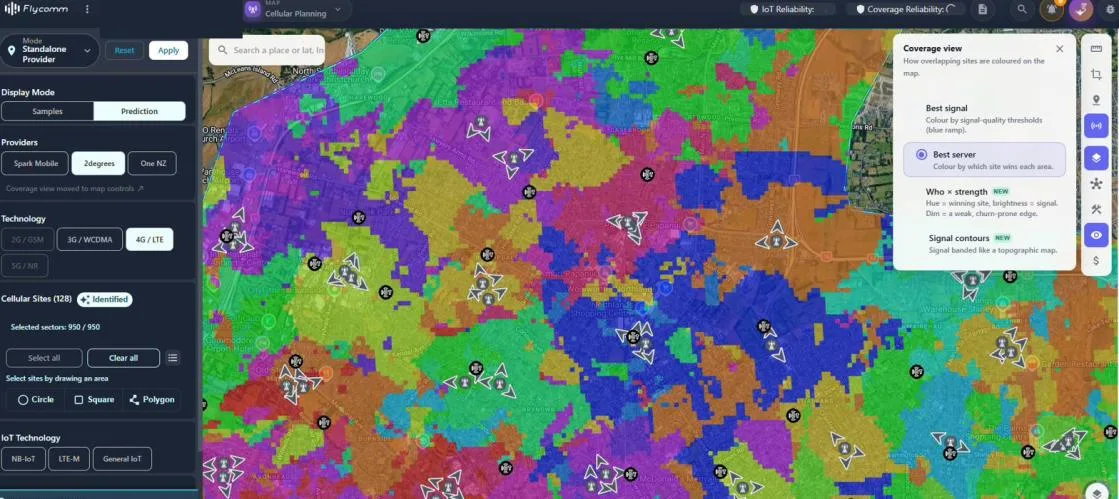
One live picture of every operator’s network around your sites.
Illustrative views here; the detail is for your demo.
The full tower and sector grid for every operator in the market, including your competitors’. Validate a candidate location remotely, without a site visit.
Nothing to request from a tenant, nothing to integrate and nothing to install. Flycomm arrives with its own measured data for every operator in the market, so the first market is live in hours.
A scoped pilot on one market or one cluster of the portfolio reconstructs the site grid, scores every asset and prices the tenant case, live in hours. The pilot is paid and fully credited toward an annual licence scaled by market, with all technologies and layers included.
Scope a pilotNo. Flycomm reconstructs every operator’s sites, sectors and coverage from its own real-world measurements. Nothing is requested from a tenant, and nothing is integrated with their core, OSS/BSS or GIS.
Yes. Every operator’s site grid in the market is reconstructed on the same basis, so portfolio and acquisition comparisons are like-for-like.
Hours on the cloud platform. There is nothing to install, and your own drive-test or planning files can be added where you hold them.
Yes. Assess a target portfolio’s footprint, redundancy and tenant exposure before the conversation, without asking anyone’s permission.
Cloud SaaS, on-premise, hybrid, or white-label with API access. Collection is anonymous and non-PII, encrypted in transit and at rest, with role-based access and a full audit trail.
An annual licence scaled by market or cluster, with all technologies and layers included. A paid pilot on one market is credited toward the licence.
Bring one market or one cluster of the portfolio. We’ll show you the measured picture of every operator around your sites, and which tenant case the data supports.
Explore your site portfolioTell us what matters to your team. We’ll show you how Flycomm can turn wireless intelligence into your next advantage.
sales@flycomm.co